Finding Your Flexible Load
In this blog post, we will dive into why DER Grid Planning needs to enable demand flexibility through bottom-up data visualization.
As we explored the challenges associated with demand flexibility, one key aspect stood out: the necessity of a data-driven approach to facilitate analysis of non-wires alternatives. The potential for significant reductions in both bulk load and localized demand is huge. RMI notes that:
“Examining just two residential appliances—air conditioning and domestic water heating—shows that ~8% of U.S. peak demand could be reduced while maintaining comfort and service quality.” [1]
However, many utilities are blind to where these flexible loads actually sit on their system and therefore they cannot appropriately plan for NWAs or even right-sized grid deployments.
This issue of visibility into the system led us to think about how to combine behind-the-meter (BTM) analytics in the form of disaggregation to grid planning and NWA analysis.
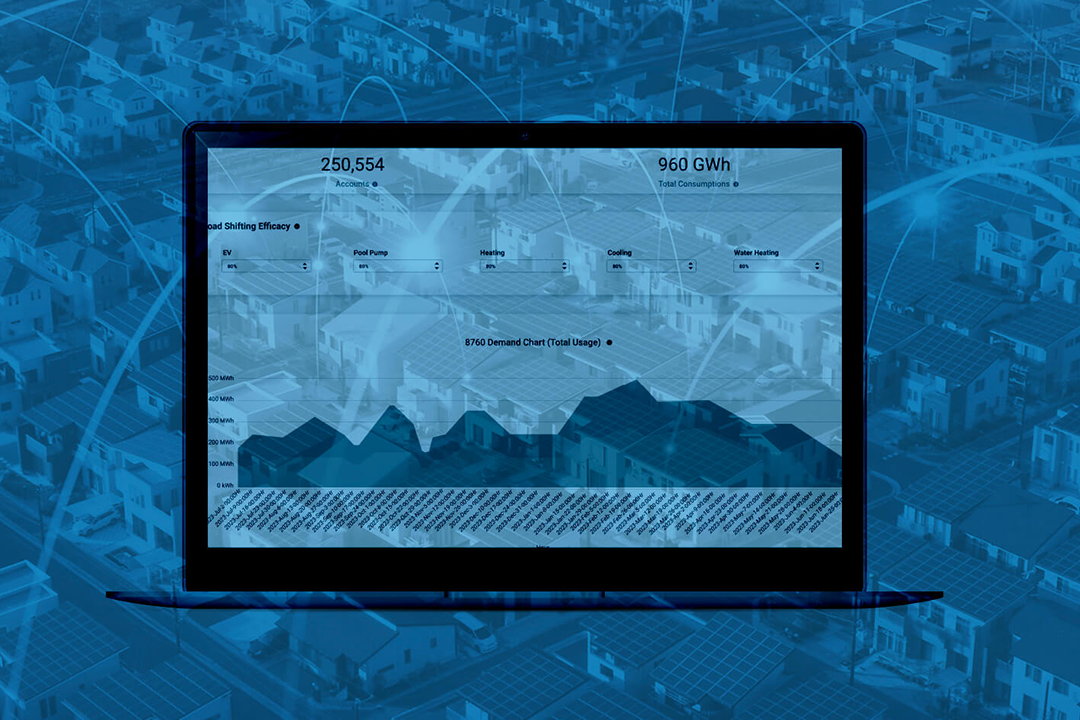
In order to provide the visibility needed we took all of the household meters on a particular circuit and performed disaggregation on each household to reveal what appliances were at the household and when the specific load was utilized.
By aggregating the 8760 load curves, along with end-use designations, from all households within the circuit, we obtained the overall load curve for that circuit. This approach allows users to pinpoint the hours of constrained grid operation over the past year and identify the potential load that can be shifted during those periods. The goal is to be able to identify if there is enough flexible load available during those constrained hours to avoid the need for costly system upgrades. While not every circuit may have the potential for non-wires alternatives, prioritizing circuits with the highest potential is essential.